OBD-II, DTC & Live Data Analysis
- chepqofficial
- Dec 19, 2025
- 4 min read

Updated: Dec 30, 2025
Modern automotive diagnostics relies on structured data access rather than isolated fault codes. The OBD-II framework provides standardized entry into vehicle systems, while diagnostic trouble codes and live data streams reveal how control modules interpret real-time conditions. Understanding how these layers interact is essential for accurate fault identification.
OBD-II diagnostics is not a single process. It is a hierarchy of communication, data capture, interpretation, and verification that connects physical vehicle behavior with digital system logic.
OBD-II as the Diagnostic Access Layer
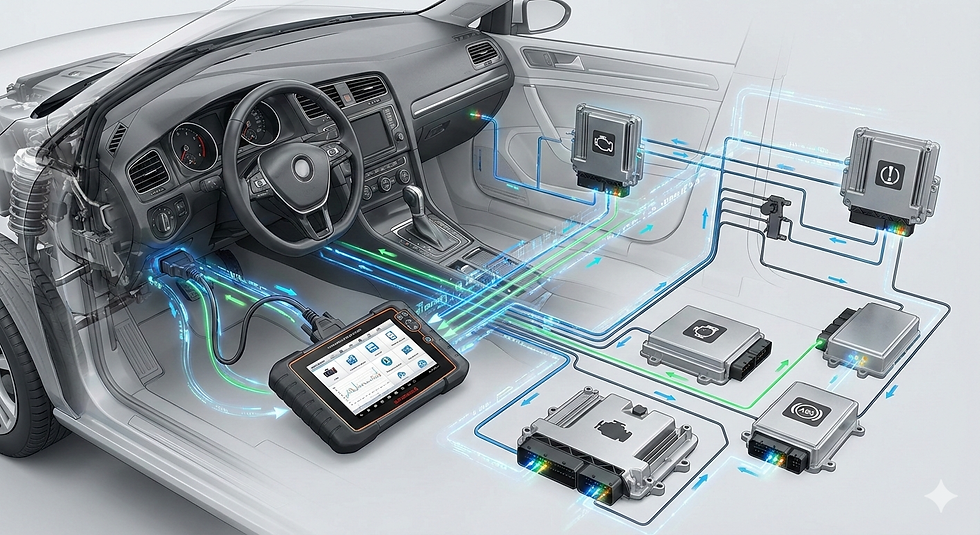
The OBD-II Port serves as the standardized gateway into vehicle diagnostics. Through this interface, diagnostic tools communicate with multiple ECUs across in-vehicle networks such as CAN Bus and LIN Bus.
OBD-II access enables:
fault code retrieval
live parameter monitoring
readiness and emissions verification
service function execution
freeze frame capture
While standardized, OBD-II behavior varies by manufacturer, model year, and system architecture, making interpretation as important as access itself.
Diagnostic Trouble Codes as System Signals
A Diagnostic Trouble Code (DTC) represents a system-level response to detected abnormal behavior. DTCs are not diagnoses; they are indicators generated when monitored conditions exceed predefined thresholds.
Each DTC typically reflects:
a monitored parameter outside expected range
a missing or implausible signal
communication loss between modules
internal ECU logic conflicts
Because ECUs rely on networked data, a single DTC may originate from upstream power, grounding, communication, or sensor issues rather than the component referenced by the code.
Freeze Frame Data and Context Preservation
When a DTC is set, the ECU often records Freeze Frame Data—a snapshot of operating conditions at the moment the fault was detected. This data captures parameters such as speed, temperature, load, voltage, and sensor states.
Freeze frame data provides context that static fault codes cannot. It reveals whether a fault occurred during cold start, high load, deceleration, or transitional states. Without this context, repeated fault reproduction becomes difficult.
Live Data Streams as Real-Time Evidence
The Live Data Stream exposes continuous parameter updates from sensors, actuators, and calculated values inside the ECU. Live data transforms diagnostics from static interpretation into dynamic observation.
Live data analysis enables visibility into:
sensor signal stability
response timing
correlation between systems
deviation trends over time
Inconsistent, delayed, or frozen values often indicate communication, grounding, or signal integrity issues rather than sensor failure.
Parameter Relationships and Correlation Analysis
Modern ECUs calculate values based on multiple inputs. Individual parameters rarely operate in isolation. Live data analysis therefore focuses on correlation rather than absolute values.
Examples include:
throttle position vs. engine load
airflow vs. fuel trim
vehicle speed vs. wheel speed sensors
battery voltage vs. system behavior
When correlated values diverge, the root cause often lies in data flow or interpretation rather than mechanical failure.
Readiness Monitors and System Verification
OBD-II readiness monitors indicate whether specific diagnostic routines have completed successfully. These monitors are critical for emissions verification and system validation.
Incomplete or repeatedly resetting monitors may indicate:
interrupted operating conditions
communication instability
incorrect sensor data preventing test completion
software or configuration mismatches
Monitor behavior reflects system-wide consistency rather than single-component performance.

Mode 6 Data and Hidden Diagnostic Detail
Mode 6 Data provides access to internal test results not always associated with active fault codes. These values reveal margin-based measurements that indicate approaching thresholds before DTCs are triggered.
Mode 6 data exposes:
early degradation trends
borderline sensor behavior
intermittent faults not yet classified as failures
Interpreting Mode 6 data requires understanding normal ranges, test conditions, and ECU logic rather than relying on pass/fail indicators.
Data Integrity and Communication Dependencies
Live data accuracy depends on reliable network communication and power stability. Fluctuations in voltage, grounding, or network timing can distort reported values.
Data anomalies may result from:
delayed message updates
dropped frames
ECU prioritization conflicts
gateway filtering behavior
These issues tie OBD-II diagnostics directly to Vehicle Network Diagnostics and Power Distribution layers.
Diagnostic Sessions and ECU States
Some diagnostic data is available only during specific ECU states. Ignition cycles, sleep modes, and session timeouts influence data accessibility.
Inconsistent scan results often stem from:
session timeouts
partial ECU wake states
security access restrictions
gateway-managed permissions
Understanding session behavior prevents misinterpretation of missing or inaccessible data.
OBD-II in Advanced Vehicle Platforms
EVs, hybrids, and ADAS-equipped vehicles generate significantly more diagnostic data than legacy platforms. Additional ECUs, higher update rates, and complex dependencies increase diagnostic depth.
In these platforms, OBD-II data interacts with:
high-voltage controllers
sensor fusion modules
gateway-managed domains
Data interpretation requires system-level awareness rather than component-focused analysis.

Data-Driven Diagnostics and Repair Accuracy
Accurate diagnostics depend on distinguishing between data symptoms and physical causes. Replacing components without validating data behavior often leads to repeated faults.
OBD-II analysis enables:
confirmation of fault reproducibility
validation of repair effectiveness
reduction of unnecessary part replacement
documentation of system behavior over time
This data-driven approach supports long-term reliability and sustainable repair practices.
How This Pillar Connects the Diagnostic Stack
OBD-II diagnostics bridges:
communication infrastructure (CAN Bus, gateways)
control logic (ECU, software)
physical systems (sensors, actuators)
diagnostic interpretation (Live Data Stream, Freeze Frame Data)
It transforms raw system behavior into interpretable evidence. Without correct OBD-II data analysis, higher-level diagnostics lose accuracy, and lower-level repairs lack validation.


